Exercises
Below is a sampling of exercises I often facilitate during making work visible workshops
Making Work Visible – Making work visible begins with clarification on what kind of work you do, how it arrives, and where it ends. Participants will identify and categorize different types of work (features, defects, risks and debt) to make worktype distribution visible – a preliminary exercise to discuss work prioritization trade-offs.
Team Pain & Business Pain Exercise – A discussion around the things that prevent teams from completing work, followed by visualizing business pain (what internal customers grumble about). Internal customer requests are important to consider when improving workflow. This exercise lays the foundation for the remaining sessions and experimentation to reduce both team and business pain points.
Too Much Work-in-Progress – The single most important factor affecting how long work sits waiting is the amount of partially completed work (work-in-progress). A look at Little’s Law shows why the more work-in-progress (WIP), the longer things take. Too much WIP results in delayed delivery of value, increased costs, decreased quality and grumpy staff. The goal of this session is to expose the amount of WIP that consumes team capacity and learn how to reduce WIP to improve speed and throughput metrics.
Making Product Dependencies visible – It’s impractical for lots of people working on lots of different things to be aware of every decision that impacts them. When it comes to dependencies, individual team performance can increase to the detriment of company-wide performance. In this session, we make dependencies between different types of products visible to unmask dependency debt.
Experiment Methods & Presentations
Data-driven experiments provide credibility when building a case for change. In this session, participants will identify experiment goals, hypotheses, activities and metrics used for experiments. The session concludes with an elevator pitch presentation to the facilitator for feedback.
The Balanced Flow Chart Exercise
The Balanced Flow Chart exercise is a great companion for chapter 3.1 of my book – Making Work Visible. It’s fairly easy to game a metric and therefore important to measure the impact of the change in one metric by showing the other metrics. People can observe negative impacts to metrics from other metric change. In this exercise, we discover what Lead time, Throughtput, Change Failure Rate (CFR) and Percentiles are by performing them by hand to learn what each can reveal.
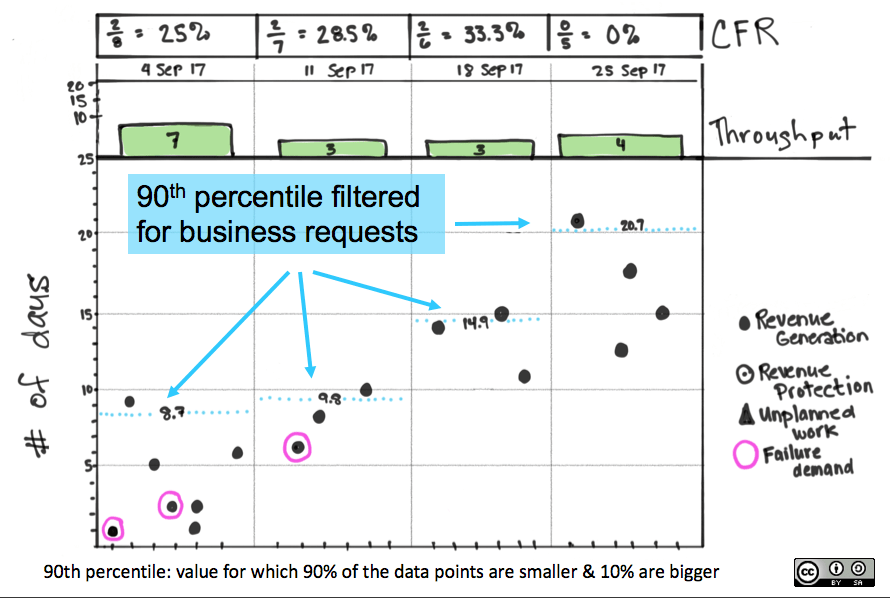
The idea here is to be approximately right instead of exactly wrong – use science & Probability to set expectations instead of arbitrary due dates.

Balanced Flow Chart Exercise by Dominica DeGrandis is licensed under a Creative Commons Attribution-ShareAlike 4.0 International License.
Based on a work at http://ddegrandis.com/